




Recent Posts
Categories
Tags
Years
What the PCE Inflation Report Means for Mortgage Rates
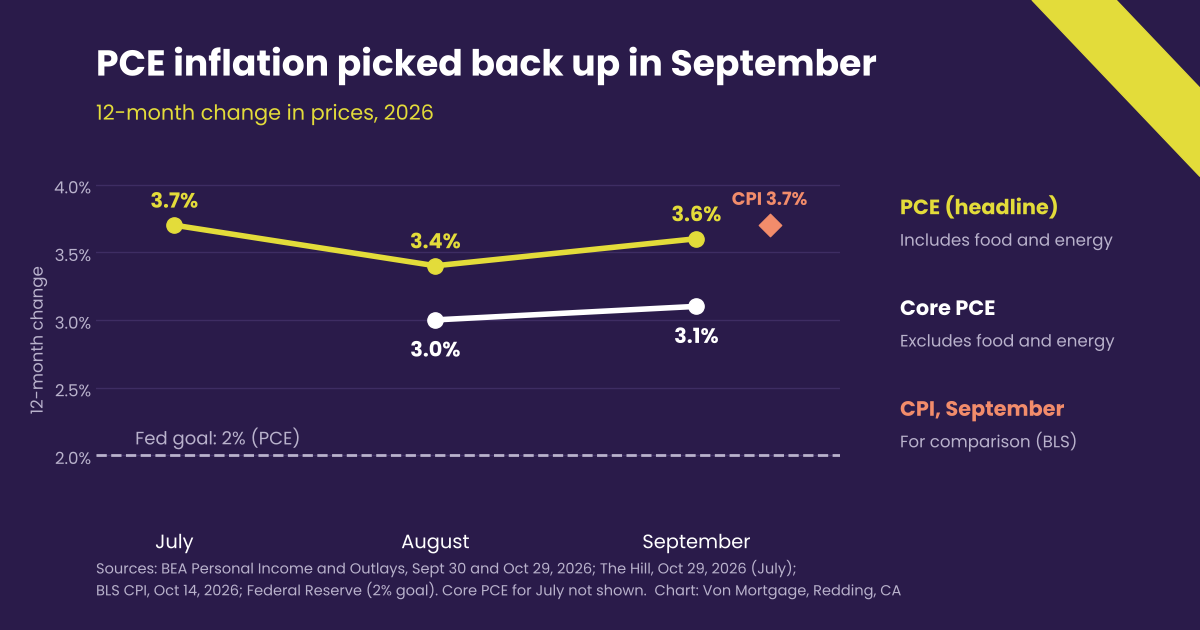
PCE inflation sped up to 3.6% in September, and core PCE, which leaves out food and energy, rose to 3.1% (Bureau of Economic Analysis, October 29, 2026). Both landed right around forecasts. That keeps a December Fed hike on the table without shocking the bond market, and the 10-year Treasury yield, which mortgage rates follow, was a little lower Thursday morning at about 5.01% (CNBC, October 29, 2026).
There's good news underneath the September number. Over the last quarter, July through September, PCE inflation ran at only a 2.1% annual pace, with core at 2.5%, down from 5.0% and 3.3% in the second quarter (BEA, October 29, 2026). That's just above the Fed's 2% target, and I see it as a good sign for inflation.
Most inflation headlines this month quoted the consumer price index, up 3.7% in the year through September (Bureau of Labor Statistics, October 14, 2026). The Fed grades itself on a different number. Its 2% goal is measured with PCE, so this is the report the Fed weighs most heavily before its December 9 decision.
What is the PCE inflation report?
The PCE price index tracks what households pay for goods and services, including spending made on their behalf. PCE stands for personal consumption expenditures. The Bureau of Economic Analysis publishes it once a month in its Personal Income and Outlays report, alongside income, spending and the saving rate.
Core PCE drops food and energy. Those prices swing from month to month, so core gives a steadier read on where inflation is heading. The next report, covering October, comes out November 25, 2026 (BEA).
What's the difference between PCE and CPI?
Both measure inflation, and PCE usually runs a little cooler. CPI, from the Bureau of Labor Statistics, tracks what urban households pay out of pocket. PCE, from the BEA, is wider. It also counts spending made for you, like the share of your health insurance an employer pays or what Medicare pays your doctor.
Housing carries more weight in CPI. PCE also updates its mix as families change what they buy, so when beef gets expensive and shoppers switch to chicken, PCE reflects the switch sooner.
September shows the gap: CPI at 3.7% (BLS, October 14, 2026) and PCE at 3.6% (BEA, October 29, 2026).
Why does the Fed use PCE for its 2% goal?
It covers more of what households spend, and its weights keep up as spending shifts. The Federal Reserve measures its 2% inflation goal with the PCE price index (Federal Reserve, October 28, 2026). By that measure, inflation has run above 2% for about five and a half years (The Hill, October 29, 2026).
What did the September PCE report show?
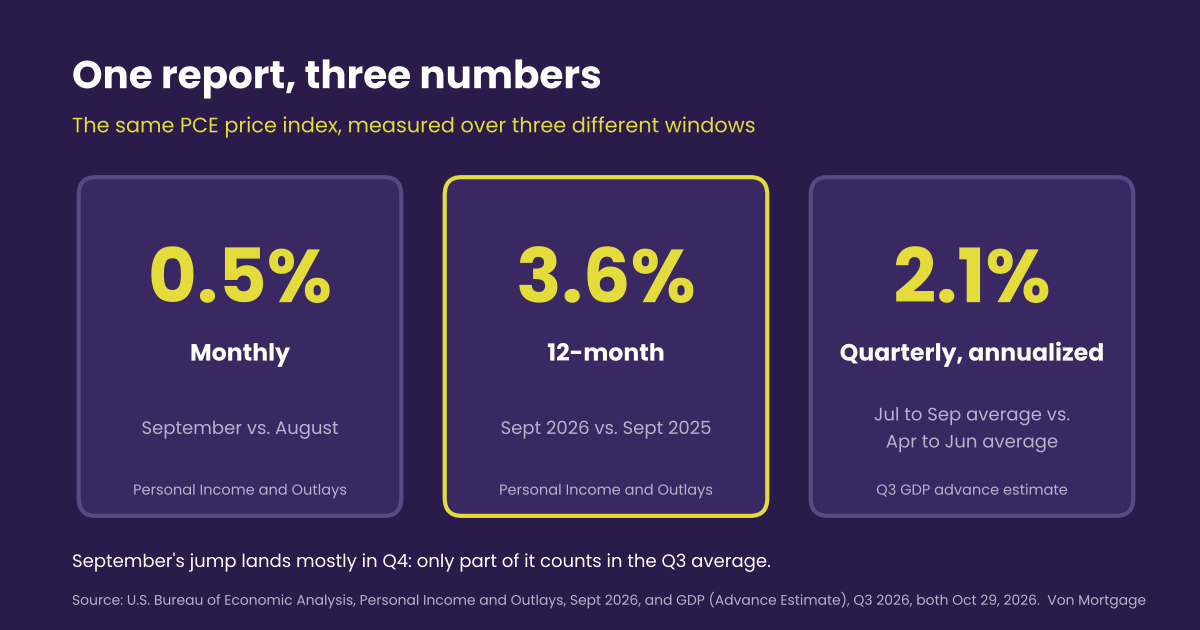
Prices rose 0.5% from August and 3.6% from a year earlier. Core rose 0.3% for the month and 3.1% for the year (BEA, October 29, 2026). In August the annual rates were 3.4% overall and 3.0% core (BEA, September 30, 2026). July's overall rate was 3.7% (The Hill, October 29, 2026).
Energy drove the jump. Gasoline and other energy goods rose 9.2% from August to September, after 4.4% the month before (The Hill, October 29, 2026). That's the oil story from our October Fed meeting preview, now showing up in the Fed's own gauge.
Wall Street saw most of it coming. The 0.5% monthly gain matched the Dow Jones consensus, the 3.6% annual rate came in a tenth of a point under the 3.7% expected, and core matched on both counts (CNBC, October 29, 2026).
The spending side looks weaker. Consumer spending rose 0.5%, or $113.1 billion, but after inflation it grew less than 0.1%. Income rose 0.2%, real disposable income fell 0.3%, and the saving rate slipped to 3.8% from 4.1% in August (BEA, September 30 and October 29, 2026). Families paid more dollars for about the same amount of goods and saved less to do it.
| Measure | September 2026 | August 2026 |
|---|---|---|
| PCE prices, 12-month | 3.6% | 3.4% |
| Core PCE, 12-month | 3.1% | 3.0% |
| PCE prices, monthly | +0.5% | +0.3% |
| Core PCE, monthly | +0.3% | +0.3% (revised from +0.2%) |
| Personal saving rate | 3.8% | 4.1% |
Why does the GDP report show PCE inflation at 2.1%?
It's the July-through-September pace, and it's the most encouraging number in this morning's reports. The third-quarter GDP report, also out today, said PCE prices rose at a 2.1% annual rate over the quarter, with core at 2.5%, down from 5.0% and 3.3% in the second quarter (BEA, October 29, 2026). That puts the quarterly pace just above the Fed's 2% target and far below where it ran in the spring.
That figure compares the average price level in the third quarter with the average in the second, then states it as a yearly pace. The 3.6% compares this September with last September, so it still carries the bigger price increases from earlier in the year. A drop that large in the quarterly pace is a good sign that inflation pressure eased over the summer. One caution: September's 0.5% jump came in the last month of the quarter, so only part of it shows up in the quarterly average. The rest carries into the fourth quarter, and energy prices will decide whether the next quarter stays this calm.
The same report said the economy grew at a 3.4% annual rate in the third quarter, up from 2.2% and above the 3.1% forecast (BEA; CNBC, October 29, 2026). A growing economy gives the Fed less reason to wait.
What does the PCE report mean for mortgage rates?
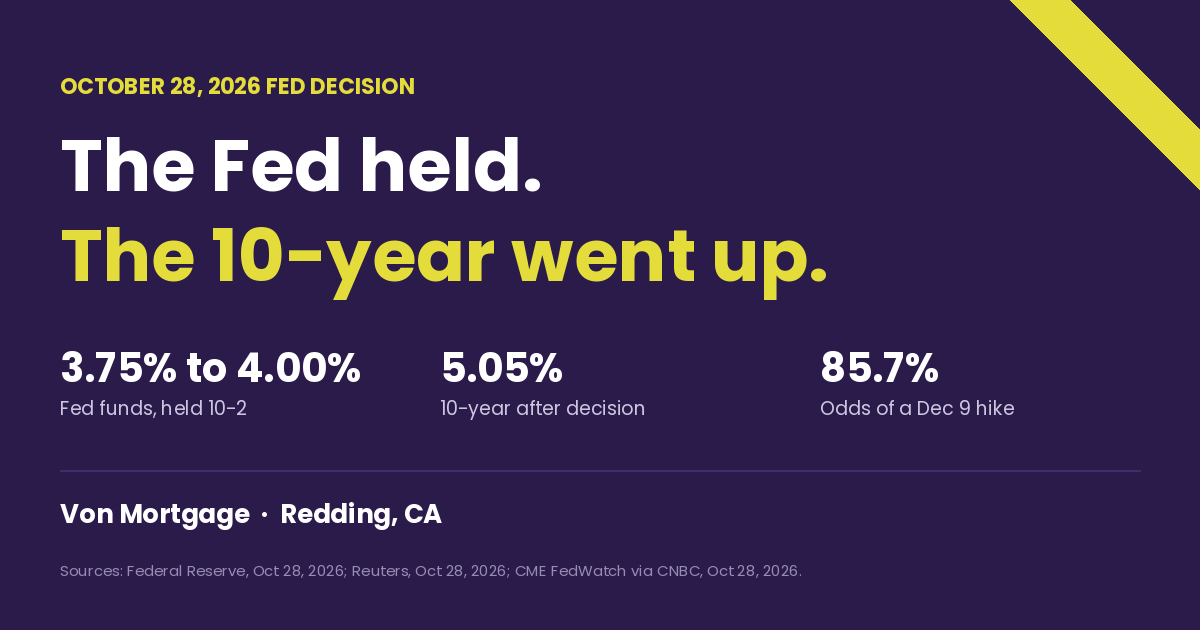
Little on its own, because nothing in it surprised bond traders. Mortgage rates track the 10-year Treasury yield, and the 10-year was down 3 basis points at 5.011% Thursday morning. The 2-year fell 3 basis points to 4.693% and the 30-year fell 2 to 5.334% (CNBC, October 29, 2026). A basis point is one-hundredth of a percentage point.
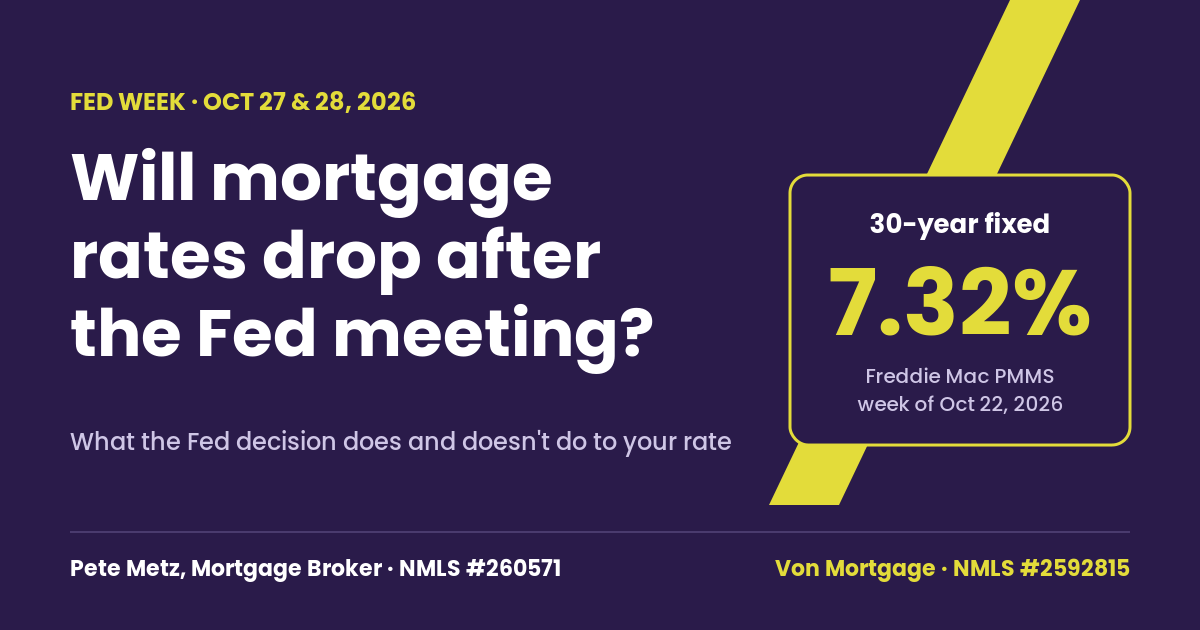
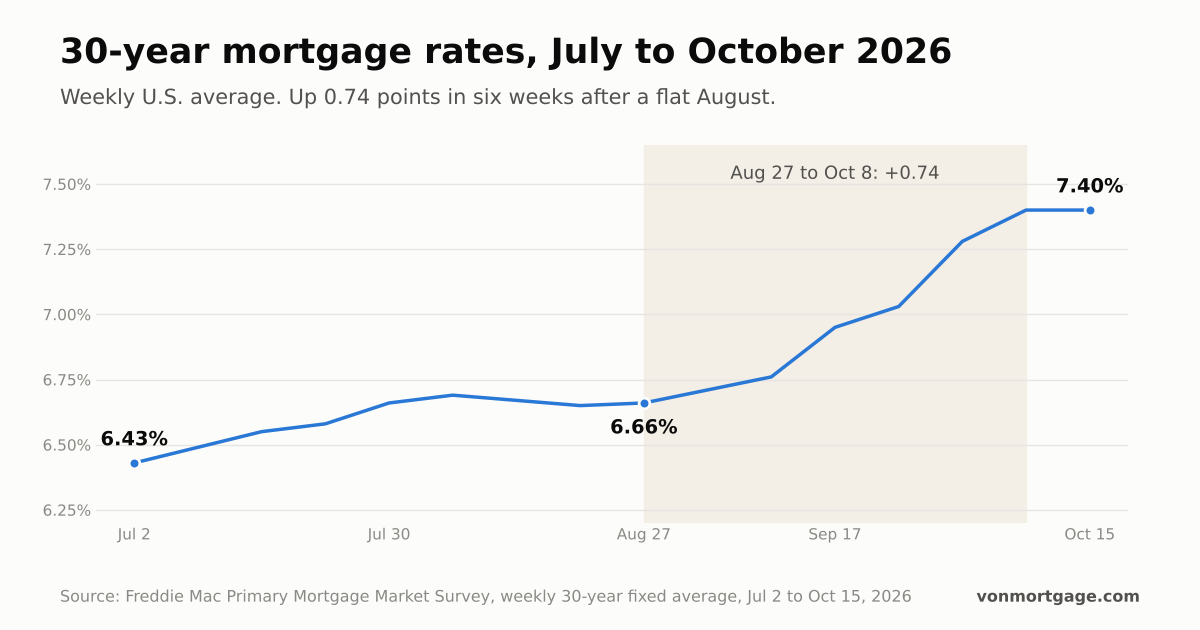
A move that small is unlikely to change mortgage pricing by itself. Freddie Mac's 30-year fixed averaged 7.32% and the 15-year 6.68% for the week of October 22 (Freddie Mac Primary Mortgage Market Survey, October 22, 2026). The next survey comes out at 9 a.m. Pacific today, so check today's mortgage rates for current pricing.
Will the Fed raise rates in December?
Markets think so. After the report, futures traders put the odds of a quarter-point hike at the December 8-9 meeting at 83% (CME FedWatch, via CNBC, October 29, 2026).
The Fed held its benchmark range at 3.75% to 4.00% on Wednesday in a 10-2 vote, with two officials wanting a hike, after raising rates a quarter point on September 16 (Federal Reserve, October 28, 2026). Chair Kevin Warsh said the committee hasn't settled on its next move. Our recap of the Fed's October hold covers the vote and what a hike would do to HELOC payments.
Today's numbers sit right on the Fed's own forecast. In September, officials' median projection had PCE inflation at 3.7% for 2026, easing to 2.3% in 2027 and 2.1% in 2028 (Federal Reserve Summary of Economic Projections, September 2026). A 3.6% reading doesn't push the Fed toward a hike any harder than it already leaned. It doesn't give it a reason to stand down either.
Three dates matter before December 9. Fed officials can speak publicly again starting Friday, October 30. October CPI comes out November 10 (BLS). October PCE follows on November 25 (BEA).
What a calm inflation morning doesn't tell you
One report that matched forecasts moved the 10-year by 3 basis points. The trend matters more. The 2.1% quarterly pace is encouraging, but every inflation measure in this post is still above the Fed's 2% goal, and the 12-month rate is still 3.6% (BEA, October 29, 2026). Energy prices can swing either way before the next report.
Your rate is its own number. Freddie Mac's survey is a national average, and what you're offered depends on your credit, down payment, property and loan type.
Rising rates also squeeze qualifying. When the rate goes up, the payment goes up, and so does your debt-to-income ratio, the share of your monthly income that goes to debt payments. A bank can offer only its own programs and guidelines. As a broker, I have access to many lenders and loan programs, each with its own guidelines, and that matters when a file is sitting at the edge.
If you're in the market to buy a home, it helps to understand why mortgage rates move up and down, and what can change how much home you can afford. Mortgage rates follow inflation. Someone lending money for 30 years wants a return that beats inflation. Inflation slowly eats away at what money is worth: when prices go up and your income stays the same, your dollars buy less. Lenders price that loss into the rate, so their money grows faster than inflation shrinks it. That's why an inflation report like this one matters to your rate.
What does this mean if you're buying or refinancing?
Don't try to time the market off one report. Make sure you're comfortable with the rate and the monthly payment, and that the home fits your budget. Waiting for an eighth of a point better can work out, and it's still a gamble.
Before anyone locks, I give every buyer a total cost analysis: the up-front costs, then the total cost over 3 to 5 years, 10 to 15 years, and 25 to 30 years. Seeing the whole stretch makes it easier to compare options than looking at the rate alone.
If you'd like that analysis on your own numbers, send me your scenario and I'll run it against today's pricing.
Disclaimer: This information is educational and is not a commitment to lend, a loan approval, or an offer of credit. Any rates, payments, down payments or other figures shown are illustrative examples only — not quoted terms and not an offer to extend credit. Actual rates and terms depend on credit, income, property, occupancy and market conditions, and change daily. For current pricing see vonmortgage.com/rates.
Pete Metz, Mortgage Broker · NMLS #260571
Dream Big Ownership LLC dba Von Mortgage · NMLS #2592815
2777 Bechelli Lane, Redding, CA 96002 · Pete@VonMortgage.com
Equal Housing Opportunity.
 Equal Housing Opportunity
Join the conversation
Comments are reviewed before they appear. Have a question about your own situation? Ask Pete directly — that stays private.
No comments yet